Debugging SAM Based TypeScript Lambdas
If you're writing out serverless apps or services using the AWS Serverless Application Model (SAM), then there's one problem you've run into - setting breakpoints and debugging it the old fashioned way. The AWS toolkit currently does not support debugging typescript with Webstorm. I hope this article helps you set up debugging in your TypeScript Lambda repo of choice.
- Install AWS SAM cli tool. Instructions on how to do so for your OS can be found at https://docs.aws.amazon.com/serverless-application-model/latest/developerguide/serverless-sam-cli-install.html
- Install Docker if not already available. Instructions on how to do so can be found at https://docs.docker.com/get-docker/
- The working TypeScript Lambda starter can be found at https://github.com/rtre84/typescript-aws-sam
The starter has .idea folder which when opened in your favourite Jetbrains IDE, ends up automatically inheriting the configuration as well. Please thank the kind soul who decided to do this.
- Install AWS Toolkit for Webstorm. This should give you the SAM Lambda local debug option.
Instructions on installing the toolkit can be found at https://docs.aws.amazon.com/toolkit-for-jetbrains/latest/userguide/setup-toolkit.html
If you notice, by default as of now (August 23rd, 2020) - a lambda handler written in TypeScript will not be picked up by default. Webstorm's debugger and the AWS toolkit need some pushing along to let us set breakpoints and debug ts files.
The workaround is to have your handler exposed via a wrapper function. I'm not entirely sure why this works or why the Webstorm debugger needs it a certain way but it does work.
Once again the link working boilerplate, check out https://github.com/rtre84/typescript-aws-sam
Assuming your lambda handler is called handler, expose it at the bottom of the index.ts or app.ts file similar to what's below.
export const lambdaHandler = (event, context) => wrapper(handler)(event, context, {});Check the file at https://github.com/rtre84/typescript-aws-sam/blob/master/hello-world/app.ts for a working example.
import {
    APIGatewayProxyEvent,
    APIGatewayProxyHandler,
    Callback,
    Context,
    Handler,
} from "aws-lambda";
import { parse } from 'querystring';
export type LambdaFnWrapper = () => (fn: Handler) => LambdaProxyHandler;
export type LambdaProxyHandler = (event: APIGatewayProxyEvent, context: Context, callback: Callback) => Promise<APIGatewayProxyHandler>|void;
const lambdaFnWrapper: LambdaFnWrapper = (): (fn: Handler) => LambdaProxyHandler => {
    return (fn: Handler): LambdaProxyHandler => {
        return (event: APIGatewayProxyEvent, context: Context, callback: Callback): Promise<APIGatewayProxyHandler> | void => {
            // TODO add any pre processing of incoming requests
            if (event.headers['Content-Type'] === 'application/x-www-form-urlencoded') {
                (event as any).body = parse((event as any).body);
            }
            return fn(event, context, callback);
        };
    };
};
export const httpFn: (fn: Handler) => LambdaProxyHandler = lambdaFnWrapper();
const middleware: (fn: Handler) => LambdaProxyHandler = (fn: Handler): LambdaProxyHandler => {
    return (event: APIGatewayProxyEvent, context: Context, callback: Callback): Promise<APIGatewayProxyHandler> | void => {
        (context as any).myName = 'Miro';
        return fn(event, context, callback);
    };
};
export const wrapper: (fn: Handler) => LambdaProxyHandler = (fn: Handler): LambdaProxyHandler => httpFn(middleware(fn));
The wrapper function can be found at https://github.com/rtre84/typescript-aws-sam/blob/master/hello-world/mw/mw.ts
- Right click the directory that contains your TypeScript Lambda source code and choose
Mark directory as. In the submenu that follows, chooseResource Root. This should solve most problems of the lambda handler not being found.
The configuration for the debugger

Select the Cloudformation template in the template field. The dropdown should populate and your Lambda function should now be selectable.
I prefer to use --debug flags in the SAM cli configuration so the output is verbose. 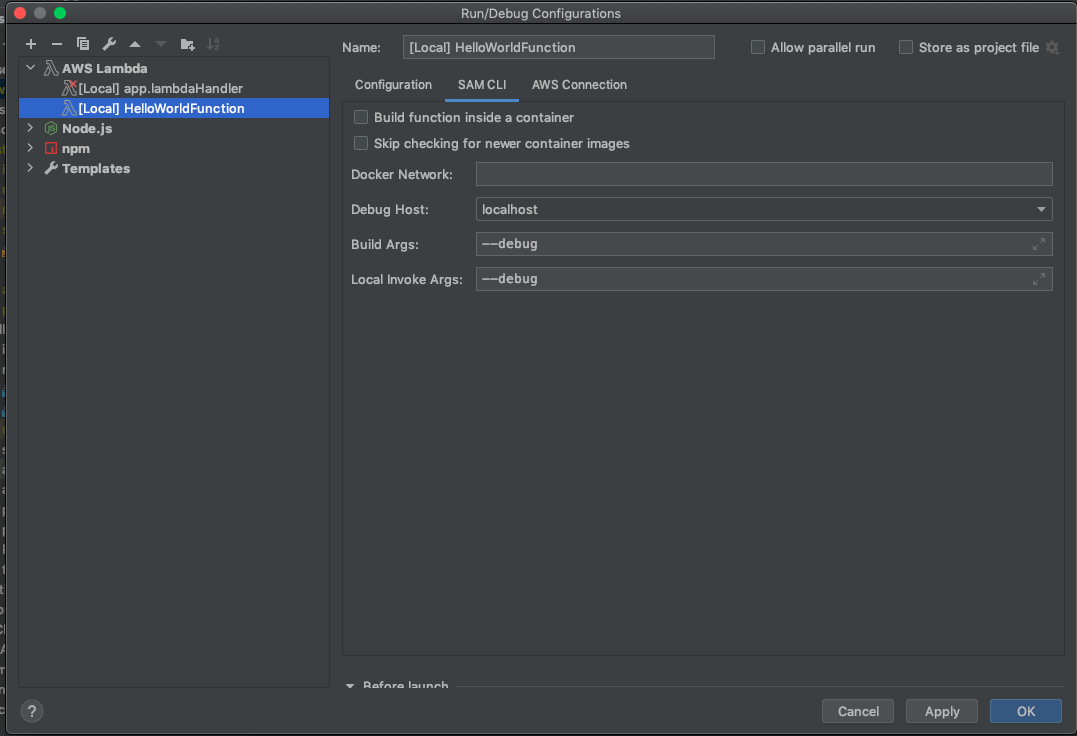
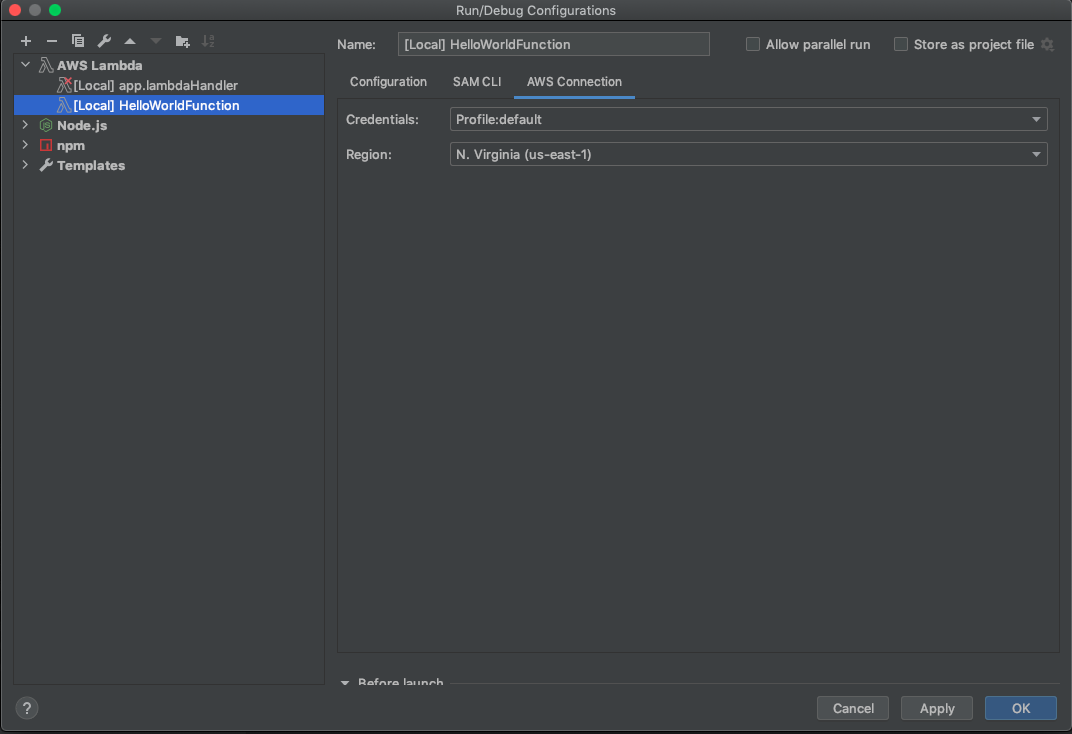
The AWS section should look similar to what's below. If you're trying this behind a company VPN or via a federated account, you might need to generate temporary AWS credentials.
In the input field, copy paste what's below to be your event template. This is only valid if you're using the boilerplate mentioned above. If you are setting up your own repo, this might not be relevant.
{
  "body": "{\"test\":\"body\"}",
  "resource": "/{proxy+}",
  "path": "/path/to/resource",
  "httpMethod": "POST",
  "queryStringParameters": {
    "foo": "bar"
  },
  "pathParameters": {
    "proxy": "path/to/resource"
  },
  "stageVariables": {
    "baz": "qux"
  },
  "headers": {
    "Accept": "text/html,application/xhtml+xml,application/xml;q=0.9,image/webp,*/*;q=0.8",
    "Accept-Encoding": "gzip, deflate, sdch",
    "Accept-Language": "en-US,en;q=0.8",
    "Cache-Control": "max-age=0",
    "CloudFront-Forwarded-Proto": "https",
    "CloudFront-Is-Desktop-Viewer": "true",
    "CloudFront-Is-Mobile-Viewer": "false",
    "CloudFront-Is-SmartTV-Viewer": "false",
    "CloudFront-Is-Tablet-Viewer": "false",
    "CloudFront-Viewer-Country": "US",
    "Host": "1234567890.execute-api.{dns_suffix}",
    "Upgrade-Insecure-Requests": "1",
    "User-Agent": "Custom User Agent String",
    "Via": "1.1 08f323deadbeefa7af34d5feb414ce27.cloudfront.net (CloudFront)",
    "X-Amz-Cf-Id": "cDehVQoZnx43VYQb9j2-nvCh-9z396Uhbp027Y2JvkCPNLmGJHqlaA==",
    "X-Forwarded-For": "127.0.0.1, 127.0.0.2",
    "X-Forwarded-Port": "443",
    "X-Forwarded-Proto": "https"
  },
  "requestContext": {
    "accountId": "123456789012",
    "resourceId": "123456",
    "stage": "prod",
    "requestId": "c6af9ac6-7b61-11e6-9a41-93e8deadbeef",
    "identity": {
      "cognitoIdentityPoolId": null,
      "accountId": null,
      "cognitoIdentityId": null,
      "caller": null,
      "apiKey": null,
      "sourceIp": "127.0.0.1",
      "cognitoAuthenticationType": null,
      "cognitoAuthenticationProvider": null,
      "userArn": null,
      "userAgent": "Custom User Agent String",
      "user": null
    },
    "resourcePath": "/{proxy+}",
    "httpMethod": "POST",
    "apiId": "1234567890"
  }
}
In the end you should have a toolbar at the top that looks something like this.

Congratulations! You should now have a working debug configuration. Set a breakpoint in a .ts file of choice and debug away by clicking 
Appendix
Another TypeScript Lambda Starter: https://github.com/mir4ef/aws-lambda-typescript-starter